There is one chart in all of the financial universe that tells me what the smartest people in the world are doing with their “big wallets” and that is the chart of long term bond yields.
If copper has a Phd. in economics, then bond yields would be the academic masters that wrote the books that copper studied en route to its degree. Long-term yields are different than short term yields because the former is demand driven while the latter is policy driven or “administered”. The Federal Reserve maestros can play Pac-Man with short term interest rates, but they can’t with long term yields because over the long term, yields will move to levels governed by FEAR. And it is fear and fear alone that drives the risk-free rate of return for holders of all the wealth in the world.
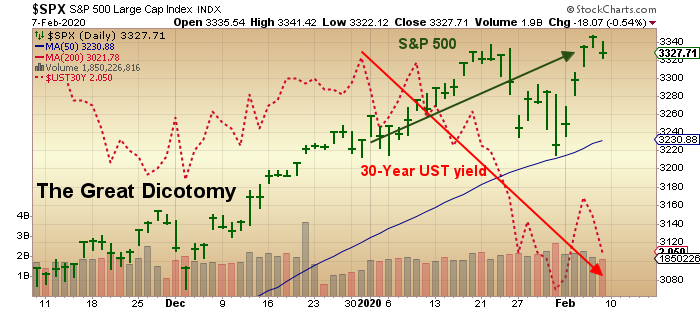
Accordingly, it is this next chart whose eardrum-splitting air raid siren is drowning out the blips and beeps of the copper chart or the ding-dong of the stock chart without a trace of indecision or reflection. Long term yields are moving LOWER and they are moving lower FAST and that, my friends, reeks of a sense of urgency verging on panic and it began long before the coronavirus arrived. The chart below is truly “The Great Dichotomy”.It is this Great Dichotomy that terrifies me and the one chart that should be required reading for everyone participating in the world of financial speculation and a rote memory prerequisite for the all serious investors.