
https://tinyurl.com/rofl7gx
OpEx Drift
For those who aren’t aware, OpEx stands for Option Expiry. Over the past few years, there has been a pronounced tendency for markets to rise in the week in front of a big expiry (typically the quarterly quad witching dates).
 |
Why is that? I couldn’t really confidently explain it until Brent from SpotGamma spelled it out in a language that my option-trader-brain could understand.
In most environments, the way the dealers’ books are setup means that the theta decay results in a short covering of hedges.
Let’s make up some theoretical positions to get a sense of how this works.
Typically, clients buy out-of-the-money put protection and fund that by selling out-of-the-money calls. Obviously that’s not 100% of the trades, but on the whole, that’s the way most dealer books set up.
So let’s go through the option math of that position. I have chosen February’s expiry and used 9% vol on the long call position and 12.5% vol on the short put position. Nothing changes between the two days except there is one less day in the calculations of the hedging deltas. What happens to the dealer’s book between those two days?
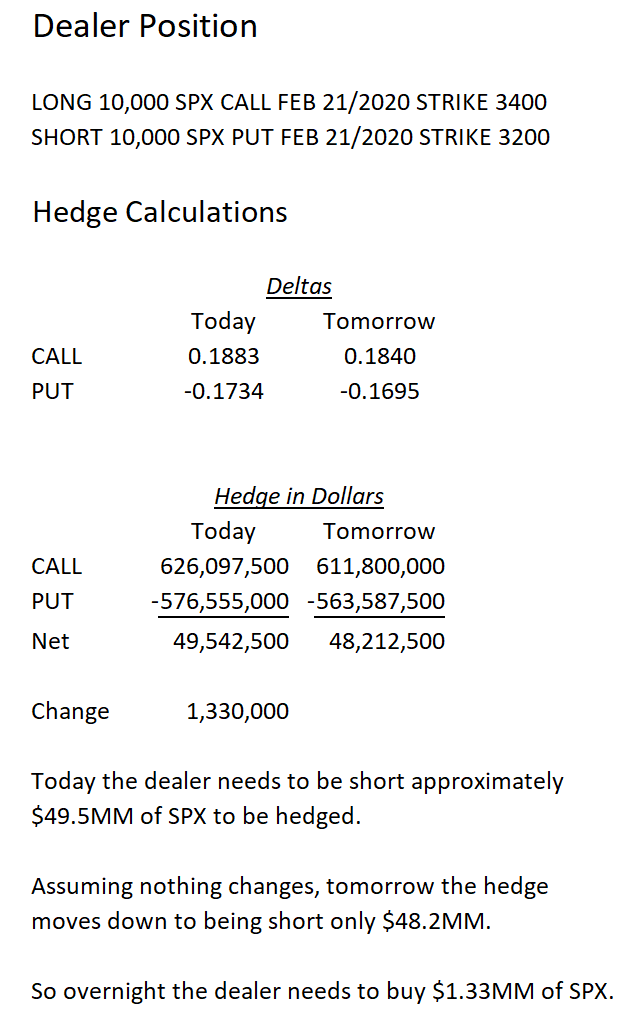 |
If you have ever wondered why we tend to rally on OpEx week – here is your answer. This tendency only gets more pronounced in the final days of expiry and the decay of the needed-hedges accelerates.
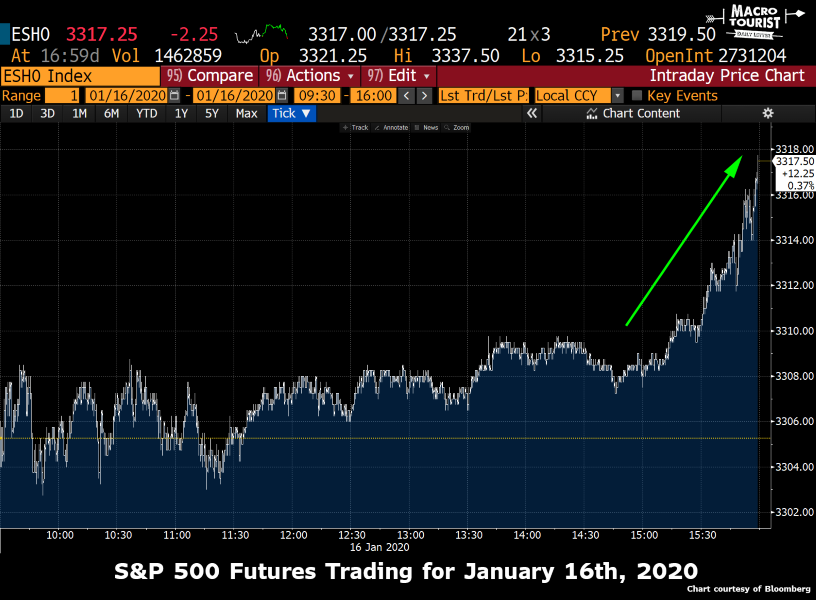
Remember last Thursday and Friday? Both days saw end of the day spikes higher.
 |
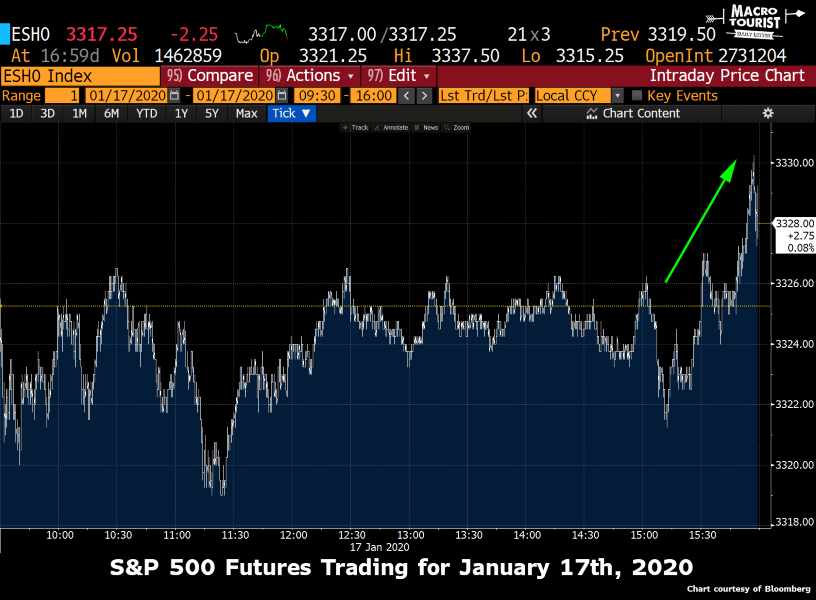 |
Do I think these spikes were solely the result of option hedging by dealers? Not a chance. Passive flows are often benched to the close so that is a contributing factor. But option expiry weeks are typically stronger than other weeks (with the next week being often showing weakness), and this option math shows why this is the case.
Don’t underestimate the upward pull of the dealers’ option book. All you need to do is look at Brent’s chart:
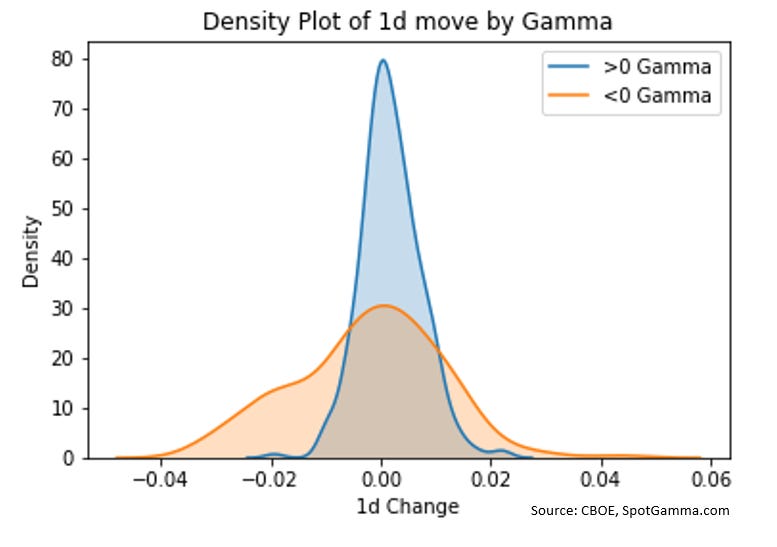 |
Look closely at the blue curve. The center is not at zero. Its mean is positive. And yes, I know that it might be self-fulfilling (quiet rising markets result in positive returns), but then again, maybe the option market is driving these tendencies more than some participants realize. I certainly used to be counted in that camp. Not anymore!