
I could see it having one more leg down to the 70 area. It is not the best chart to use.
I like the PSLV chart or the AG (First Majestic) charts much better.
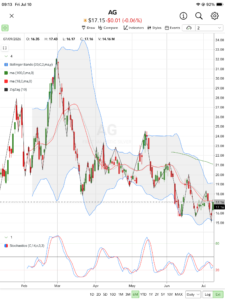
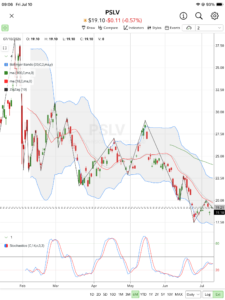
In both the slow stochastics looks good. Now the challenge is to take out the 18 day sma and successfully test it.
aurum