
Where’s The Bottom? – Cycles Paint A Clear Picture
https://futures.tradingcharts.com/chart/GD/M?anticache=1584116990
5 YR CHART OF GOLD PRICES-2016 low$1063—2018 low–$1189 on sept 1st
This analyst sees gold going to 2018 low–if that doesn’t hold then 2016 low
Has the selloff ended? When will it end? What will the bottom look like and am I at risk of taking further losses? What should I do?
Over the past 16+ months, we’ve suggested that the price rotation in 2018 was a Wave 4 downside price rotation of a Wave C upside price structure. If our analysis is correct, the last rally we just experienced (ending near February 1, 2020) was the end of a Wave 5 upside price move that completed the Wave C upside price structure. This would indicate a very real possibility that the current downside price trend is a Wave 4 downside price move.
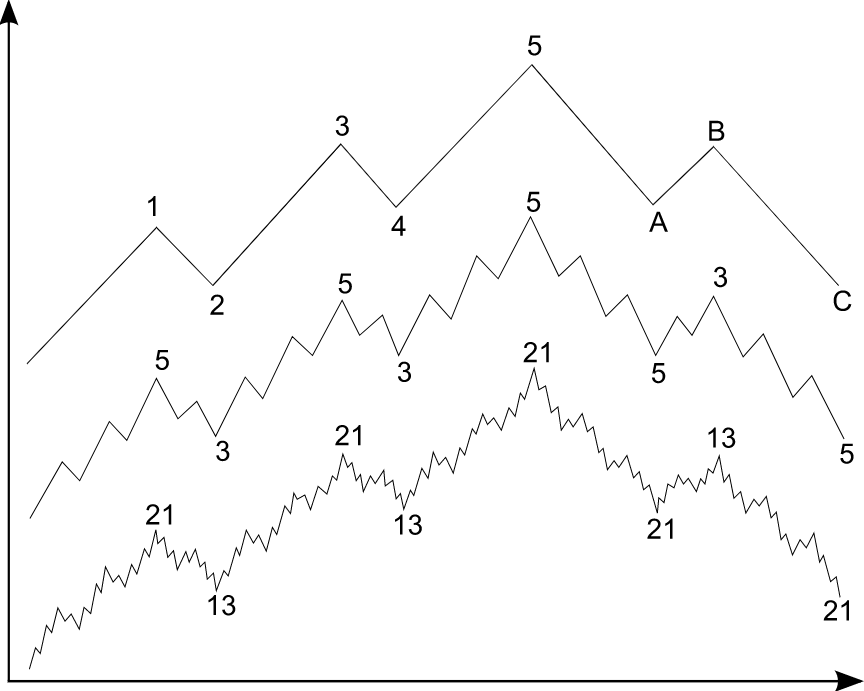 For readers that are not familiar with the Elliot Wave process/structure, each major wave (1 through 5 or A through C) can consist of various types of minor wave structures (as you can see from the middle chart in the example above. The major wave 1 could consist of a 5 wave minor wave structure (as shown). The major wave 2 could consist of a 3 wave minor wave structure (as shown) or even a downside 5 wave structure.
Going even further, each of these minor wave structure could consist of even smaller price wave structures. These types of price rotations often populate in 1, 3, 5, 7, 9, 13 and 21 wave structures. Unlocking the major wave count and minor wave count can help us unlock swing trading and day trading opportunities.
So, to put into context what we are attempting to convey to you is that we believe the peak in early February 2020 was the end of a major wave 3 and the start of a major wave 4 (to the downside). Because the upside price wave 3 originated after the 2009-10 price bottom, we believe true support in the markets is likely the midpoint of the 2018 price rotation range or near the low price levels of 2018. These price levels represent a very clear support level and low price target level that continues to follow the price structure rules of Fibonacci and Elliot Wave. If the 2018 lows are breached and the markets continue to push lower, then we fall back to the 2016 price lows and midpoint level.
https://www.gold-eagle.com/article/wheres-bottom-–-cycles-paint-clear-picture