
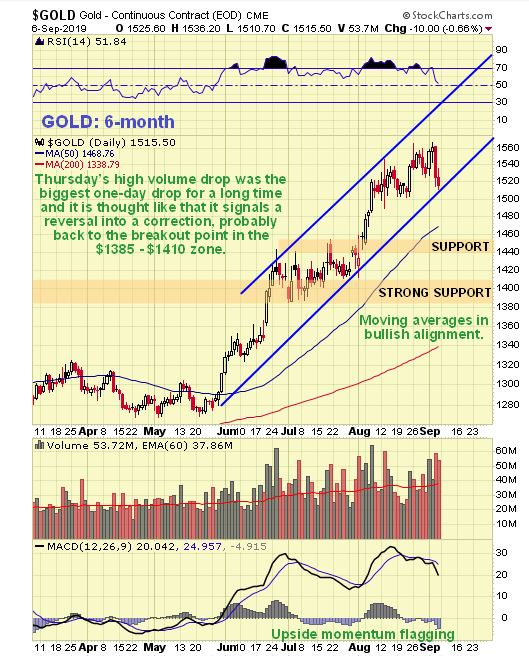
Starting with gold’s 6-month chart, we can see that it doesn’t look too bad – yet, but if we look more closely we can see that it is on the point of breaking down from the rather steep uptrend in force from late May, with it having dropped back on quite high volume the past 2 trading days, and it is noteworthy that Thursday’s drop was the biggest 1-day drop for a long time, making it more likely that it signals a reversal. In addition, the MACD indicator shows that momentum is starting to flag
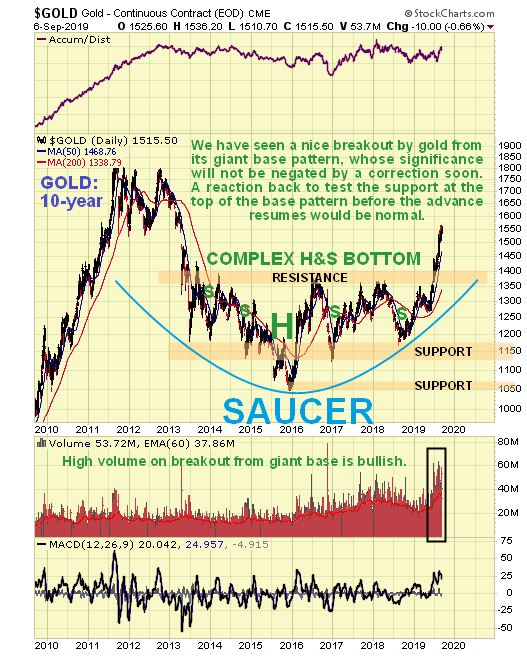
 So, how far could gold react back? It happens more often than not that after a price breaks clear out of a giant base pattern, as gold did from its giant complex Head-and-Shoulders bottom or Saucer base shown on our 10-year chart, that it then returns to test support at the upper boundary of the base pattern before turning higher again. That could happen again and it would throw a lot of investors in the sector who are now of the view that we are “off to the races”. So, if it does react back that far don’t be dismayed – on the contrary it would throw up one last great buying opportunity
We have had a rather unusual situation in the recent past where the dollar and the Precious Metals have been strengthening together. This is because, in a risk off environment both have been considered safe havens. In a risk on environment this logic works in the other direction so that the dollar and the Precious Metals may both react back together. On the 3-year chart for the dollar index we can see that it is at a good point to turn lower, despite its still bullishly aligned moving averages, as its persistent gentle uptrend has brought it up to the significant resistance level shown.
https://www.kitco.com/commentaries/2019-09-09/Gold-market-update.html