
Buygold @ 10:23
Yes earnings should be spectacular and show the shares are still cheap.
Maddog has a good chart showing the shares against gold is still in the basement but threatening to breakout.
The bankers are a desperate lot … so it would not surprise me if they can engineer a bit of a selloff back below $50 one more time … they will smash the lease rates and/or increase margins when the bullion from abroad is on tap … but after that hang on to your cojones for a wild ride to triple digits.
Of course, $50 may never be seen again.
So trade this at your own risk.
That said … bitcon looks like it’s getting ready for a railing … and it will take tech with it … and at some point liquidity concerns should also impact the metals as well.
So … no margin on my toast please.
I’m on a diet and looking to trim a bit.
Chuckle
You’d have thought
that our “leaders” in the past 10 or 20 years would have given some thought as to how important rare earths are and made some provisions for it’s production here.
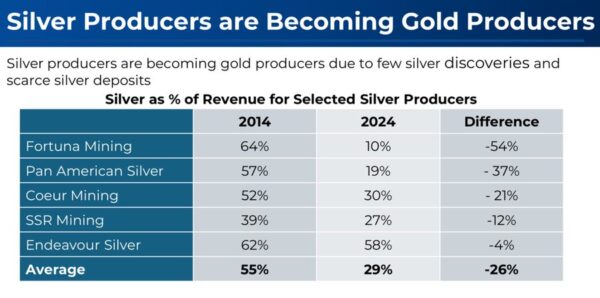
More good news for silver investors from Jesse Colombo
Why I’m Betting on a 10x Move in Silver
Now I want to talk about an exciting prospect that I firmly believe in and am personally investing in. I expect silver to surge at least tenfold from its current price, which would mean a move from around $52 an ounce today to at least $500 an ounce.
To understand this setup, let’s start by looking at the long-term price chart of silver going all the way back to the 1960s. Next, I want to draw your attention to the critical $50 level, which marked the peaks of the last two major silver bull markets in 1980 and 2011, both of which were followed by significant declines.
But a major development is happening as we speak as silver finally breaks above the all-important $50 psychological level. This signals the start of a powerful new secular bull market, which typically lasts for a decade or more. That indicates silver still has a long way to run.
 |
With silver now trading above $50, an all-time high, no one who has ever purchased silver is currently sitting on a loss.
I believe this breakout is about to spark a major shift in investor sentiment toward silver, which has long been viewed as a lagging and underperforming asset compared to flashier alternatives like high-flying tech stocks and cryptocurrencies.
Many of the new investors that are about to enter the silver market will come from the younger generations that aren’t burdened by the past disappointments of 1980 and 2011 that shaped the views of older, battle-weary silver investors.
Although investment demand for silver has been subdued over the past decade, I expect it to increase significantly as the bull market continues to strengthen. U.S. silver ETFs, in particular, have only recently started accumulating silver more actively.
For example, the iShares Silver Trust (SLV), the largest U.S. silver ETF, increased its physical holdings from 417.5 million ounces to 496.53 million ounces over the past two years. That 19% rise is modest compared to the 160% surge in silver prices over the same period. I believe that gap will close soon, driving silver prices much higher.
 |
There are many reasons why I expect silver to surge from here rather than fall from the $50 level as it did in 1980 and 2011. One key reason is that silver remains far cheaper in real terms today compared to those past peaks when measured against a wide range of benchmarks. This indicates that silver still has substantial room to rise.
To further reinforce my point above, I also want to show you the ratio of silver to the U.S. M2 money supply, indexed to 100. This may be an even more accurate measure of inflation than the Consumer Price Index (CPI) used to create the previous chart. After all, the root cause of inflation is growth in the money supply itself. As Milton Friedman, the Nobel Prize–winning economist, famously said, “Inflation is always and everywhere a monetary phenomenon.”
This chart shows that although silver is approaching the same nominal price of $50, its real-world price is much lower than it was in 1980 and 2011. For example, in 1980 the ratio was 1,038, in 2011 it was 176, and now it is just 66. I see this as clear evidence that, despite its recent gains, silver’s bull market is nowhere near being long in the tooth.
 |
Another eye-opening metric that confirms silver is still extremely cheap is the ratio of silver to the U.S. national debt, which now stands at $37.8 trillion and is growing at an alarming pace of $1 trillion every 100 days with no signs of slowing. This is an important metric because it shows whether the price of silver has kept pace with the growth of the national debt, and the answer is clearly no.
The chart, indexed to 100, shows that this ratio was 1,377 at the 1980 peak, 87 at the 2011 peak, and only 33 today. This indicates that silver has substantial room to catch up to the expanding national debt. In that context, $52 silver is not expensive by any measure, and a move to $500 an ounce is far from inconceivable.
 |
Next let’s move on to another metric that confirms that silver is still much cheaper today than it was at the peaks in 1980 and 2011, despite its recent gains. This time, we will look at the silver-to-gold ratio, which is a useful way to determine whether silver is undervalued or overvalued relative to gold, the leading benchmark in the precious metals market.
While gold has always been more expensive than silver throughout history, the gap between them has varied significantly. At the 1980 peak, silver was 6.7% of the price of gold. At the 2011 peak, it was 3.3%. But now, silver is just 1.2% of gold’s price, which is far below historical levels.
This indicates that silver is extremely cheap by historical standards and still has substantial room for its bull market to continue.
 |
Now let’s get to the core reason why I believe silver will surge at least tenfold from here, reaching $500 an ounce or more. And that reason is the powerful chart pattern silver has been forming over the past six decades, known as a cup and handle.
Because of the magnitude of that pattern in both duration and scale, it indicates that silver is set to rise by a massive amount to match its proportions.
The $50 resistance level marked the top of that pattern, and as of this week, silver is finally breaking above it. This breakout signals the start of what will be the largest bull market in silver’s history. It is a rare opportunity that no investor should overlook. I’m personally heavily invested in both physical silver and silver mining shares, which are leveraged to the price of silver.
 |
And if you think a tenfold surge in the price of silver from here sounds far-fetched, it’s really not. There are several reasons for this, starting with how undervalued silver remains. But more importantly, we are facing a runaway global debt crisis. As you can see in the chart below, global debt has soared from just $25 trillion thirty years ago to an astounding $250 trillion today.
Unfortunately, this number is poised to rise even more sharply from here, approaching a near-vertical trajectory. This kind of exponential debt growth is a hallmark of the final stages of fiat or paper currency systems, and will cause a massive global financial and monetary crisis that will send silver into the stratosphere. In that scenario, $500 an ounce is not only realistic, it could prove conservative once the coming hyperinflationary storm fully takes hold.
 |
To summarize, I’m extremely excited about silver’s prospects over the next five to ten years. As of this week, silver is beginning its most powerful bull market yet.
I’ve made my case with multiple factors, including how undervalued silver remains by various measures, the anticipated influx of capital from U.S. ETFs, the accelerating global debt crisis, and the extremely promising technical setup implied by the six-decade-long cup and handle chart pattern.
At this point, I believe everyone should own at least some silver—even if it’s just a few ounces.
If you enjoyed this report, it’s just a small preview of the kind of content you’ll receive as a paid subscriber to my bestselling newsletter, The Bubble Bubble Report.
This content has resonated strongly with savvy investors, helping this newsletter grow into one of the most respected precious metals and commodities publications worldwide, with thousands of paid subscribers.
Morning maddog, Captain
The way things looked earlier, I thought maybe the Crimex was going to get us, but now it doesn’t look like it. Almost looks like silver has a real chance of busting $53 again now that gold has broken $4200.
Interesting about the price of the shares and only 8% vs. the avg. between 1980 – 2008. I keep thinking they are way overbought – and they are technically – but fundamentally I think they are still way cheap, even with the run they’ve had.
Earnings start coming out next week with NEM on the 23rd and they should be great, but next quarter they’ll be even better. The cost of pulling metal out of the ground shouldn’t be increasing too much, if at all. The silver shares earnings are going to blow the roof off the place.
The Great Mining Stock Explosion: Why Gold Miners Are Still Poised for a Historic Mean Reversion Higher!
From the 1980s through the 2008 financial crisis, the XAU Index maintained a consistent relationship with gold, averaging between 17-35% of gold’s value. Today its still under 8%!

H/T Michael Oliver of MSA for chart
For over three decades, from the 1970s through the 2008 financial crisis, the XAU Philadelphia Gold and Silver Index maintained a consistent relationship with gold, averaging between 17% and 35% of gold’s value.
This ratio was as reliable as gravity; when gold moved, miners moved proportionally, often with explosive leverage to the upside. Then 2008 changed everything. The XAU/Gold ratio collapsed to a historically unprecedented 5-8% range and has remained trapped there for over 15 years.
Even with the recent surge in mining stocks, the ratio hasn’t exceeded 8%. But history suggests this compression is temporary.
When the ratio finally breaks back into its historical 17-35% channel, mining stocks won’t just double; they could explode 300-400% as decades of undervaluation unwind in a violent mean reversion.
The Historical Relationship That Defined Precious Metals Investing
From the late 1970s through 2008, the relationship between the gold and silver miners vs. gold was remarkably consistent. The XAU Philadelphia Gold and Silver Index, which tracks the performance of companies in the gold and silver mining industry, maintained a ratio between 17% and 35% of gold’s price. This wasn’t a coincidence; it reflected the fundamental economics of gold and silver mining.
The math was straightforward and the index kept pace with gold’s ascent and descent. This relationship held through multiple bull and bear markets, economic cycles, and geopolitical crises. It was the bedrock assumption of precious metals investing: miners provided leveraged exposure to gold with predictable parameters.
The ratio wasn’t static; it oscillated within the channel. During gold bear markets, the ratio would compress toward the lower rail at 17%. During gold bull markets, it would expand toward the upper rail at 35%.
|
|
||||||
|
maya: 3:14
i’m not quite as tropical as you. i wish i could grow cocoa.
semi-tropical here in the north florida boonies. we even got snow last winter (first in almost 30 years) but my 20′ brazos belle avocado tree produced a small crop in spite of it.
Lots of upside avilable in XAU/Au ratio
note finding some resi at halfway point
I guess we’re still battling for $4200
Silver kicked above $53 at some point last night, but has slipped back.
Regardless, the sector looks great again.
SM is up, dollar and rates down.
Who cares what Bitcoin is doing?
goldielocks
Re Vax-Unvaxx
No matter how hard they try, that info is getting out, thanks to the Web and peoples own experience…..
In the UK there is History Professor who is also a brilliant commentator on life…David Starkey….he reckons Musk buying X was possibly the most important event this Century .
Maya
You should have it tested for heavy metals. If it doesn’t have lead and cadmium like the areas that grows it, it would be preferred to others as safer and sell it to some small bakery business that uses them.
$4200 falls
after a raging battle….
Gold Train

Central Pacific private antique
https://www.railpictures.net/photo/888417/
https://www.railpictures.net/photo/888416/
treefrog @ 15:47 – cocoa
I do the same with my morning coffee, except… I grow my own cacao and process, dry, and grind the beans. Chocolate is becoming a local industry in Hawaii.
Looks like yesterday
Silver up a buck, gold up $50.
The came in last night near this time and dismantled our gains to provide cover for the LBMA.
The only difference I see is that the dollar is down some tonight.