
The next chart shows the percentage growth of the two data series from the same 1995 starting date, again based on real (inflation-adjusted) data. We’ve added markers to show the precise monthly values and added callouts to show the month. Margin debt grew at a rate comparable to the market from 1995 to late summer of 2000 before soaring into the stratosphere. The two synchronized in their rate of contraction in early 2001. But with recovery after the Tech Crash, margin debt gradually returned to a growth rate closer to its former self in the second half of the 1990s rather than the more restrained real growth of the S&P 500. But by September of 2006, margin again went ballistic. It finally peaked in the summer of 2007, about three months before the market.
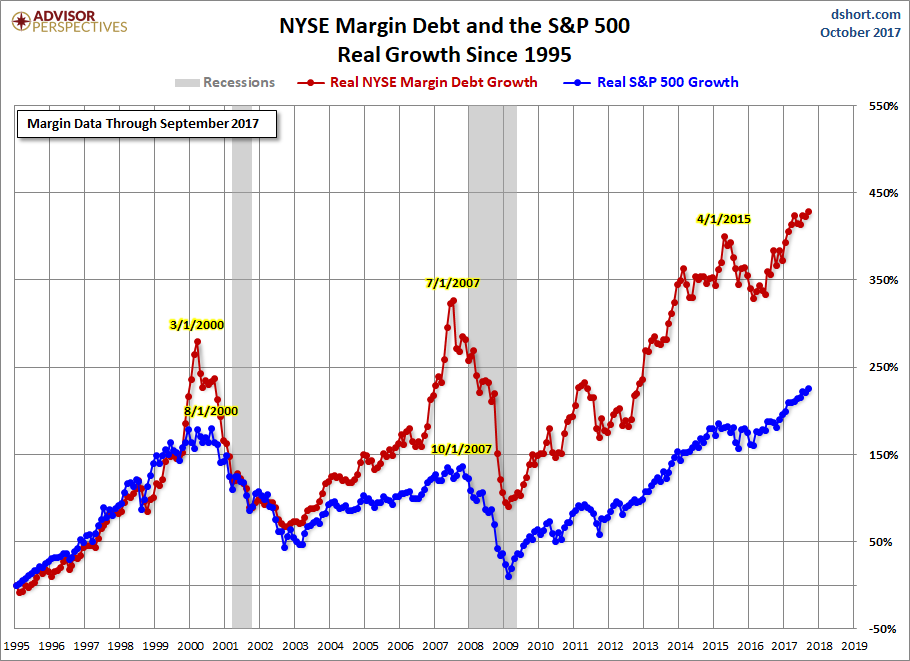
After the market low of 2009, margin debt again went on a tear until the contraction in late spring of 2010. The summer doldrums promptly ended when Chairman Bernanke hinted of more quantitative easing in his August 2010 Jackson Hole speech. The appetite for margin instantly returned, and the Fed periodically increased the easing. Even with QE now history, margin debt has reached another record high. The latest peak may not be a Fed-induced, easy-money bubble due to QE, but perhaps a response to the latest equity market rallies. It remains in high gear, as evidenced by the S&P 500 having logged over twenty record closes since the presidential election. For reference, last summer saw ten record closes and in November of 2014, there were twelve. As of this posting, the index is less than 1% below its latest record close.


